Today I used the brainstorming ideas to decide the three different visualisations using the same data.
I will visualise:
1. The path from the source of the ‘personal data’ to the other side, where it is received.
2. The transition type (the process in which a webpage is opened)
3. The time frame I have been using the internet.
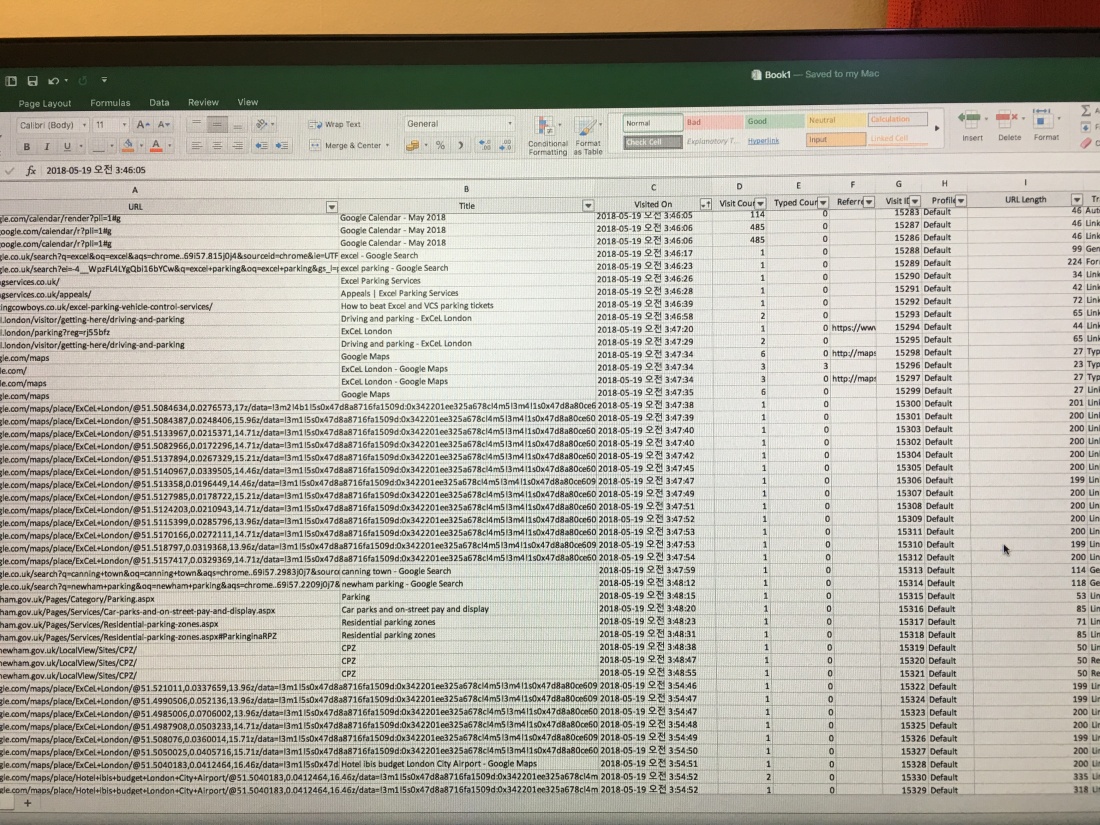
In order to show that data, I have used the software ‘ChromeHistoryView’ to export the relevant data as I only use Chrome for my internet browsing and it has all my information. I used the software to export 1 day’s usage to visualise my data from there. This is what the data looked like: